



A common theory among crypto Keno players sounds completely logical on paper: since a standard 10-pick draw averages roughly 2.5 hits per round, why not just pick 3 numbers and lock in frequent full-card jackpot wins?
The Context of Hitting 3 Numbers
Matching 3 numbers means two entirely different things depending on your card setup. The mathematical reality depends entirely on your total card size:
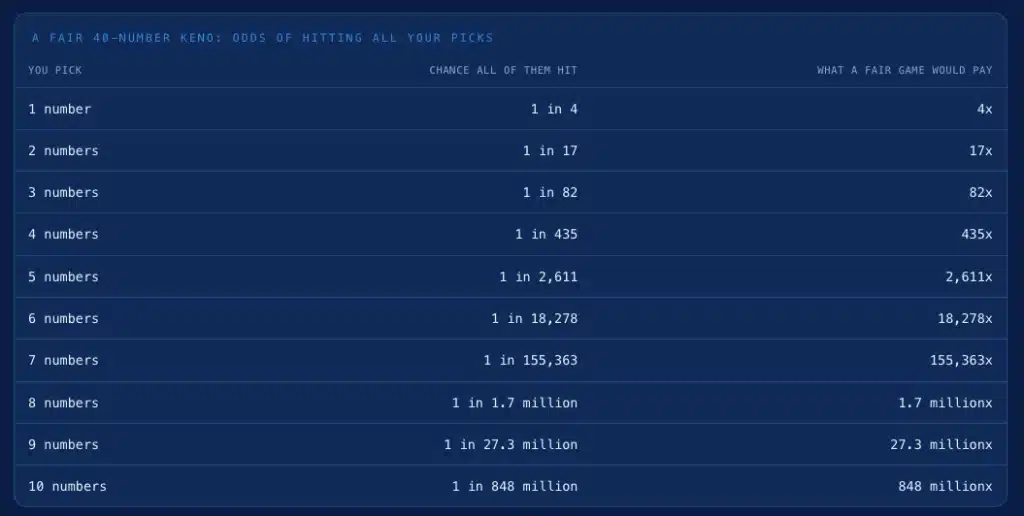
- On a Pick 3 Card: Hitting 3 out of 3 requires a 1 in 82.1 event (1.21% chance). It is the top jackpot prize for that setup.
- On a Pick 10 Card: Hitting 3 out of 10 occurs once every 3.5 rounds (28.9% chance). It is a routine, below-average consolation result.
Evaluating a hit counter without considering card size is a common trap. A 3-hit outcome on a low-pick card is a rare jackpot event, whereas a 3-hit outcome on a high-pick card is a routine partial return that fails to recover your full wager.
How Pick Count Shapes Volatility
Adjusting your pick count does not change the keno’s baseline payback rate, but it drastically alters outcome concentration.
Low Pick Counts (Pick 1 to Pick 4) mean High Concentration:
With fewer total numbers on the board, there are fewer possible outcome combinations. On a Pick 3 card, you either hit 3 out of 3 for the main payout or land smaller partial returns. Payouts are concentrated into fewer, higher-impact hit triggers.
High Pick Counts (Pick 7 to Pick 10) mean High Dispersion:
High pick counts create a wide distribution of potential outcomes from 0 through 10 hits. You experience frequent small token returns on 2, 3, or 4 hits, smoothing out short-term bankroll variance while pushing top multipliers into ultra-rare statistical territory.
Payout Compression Across Pick Counts
The most critical mathematical distinction between low and high pick strategies is payout compression.
On low pick counts, casino paytables closely mirror mathematical fair odds. As pick counts scale toward 10, operators are forced to apply heavy reductions to top prizes to fund partial payouts:
| Pick Count Configuration | Mathematical Fair Odds | Actual Classic Multiplier | Paytable Compression Impact |
|---|---|---|---|
| Pick 1 (1/1 Hit) | 4.0x Fair Odds | 3.96x Multiplier | Nearly 100% fair payout |
| Pick 3 (3/3 Hit) | 82.1x Fair Odds | 81.5x Multiplier | Minimal payout trim |
| Pick 5 (5/5 Hit) | 1,551x Fair Odds | 500x Multiplier | Moderate reduction |
| Pick 10 (10/10 Hit) | 847,660,528x Fair Odds | 100x to 1,000x Multiplier | Extreme multiplier cap |
Because paying 847 million to 1 on a Pick 10 jackpot is mathematically impossible for casino risk management, operators apply massive payout compression to top tiers. They reallocate that payback budget into frequent, low-tier partial matches that keep your session afloat.
Pick Strategy Comparison
| Strategy Metric | Low Pick Strategy (Pick 1 to 3) | High Pick Strategy (Pick 8 to 10) |
|---|---|---|
| Outcome Style | Concentrated and direct | Dispersed and multi-tiered |
| Variance Handling | High short-term swing with zero partial bloat | Smooth variance via frequent 2 to 4 hit partials |
| Fair Odds Match | Extremely high with minimal payout trim | Low on top prizes due to heavy caps on 8 to 10 hits |
| Best Used For | Direct system play and quick target sessions | Extended entertainment and slow bankroll drift |
Want to model hypergeometric odds for every pick count from 1 to 10? Explore our full interactive study: Keno: The Hidden Risk Dial.






Login
Register