



When you open a Crypto Keno game on any platform, the layout looks virtually identical: a grid of 80 numbers, pick counts from 1 to 10, and familiar risk buttons.
The 4 Crypto Keno RTP Tiers Explained
Crypto Keno paytables are not standardized across the industry. Depending on where you play, baseline Return to Player (RTP) ranges from a hyper-competitive 99.95% down to 96.00%.
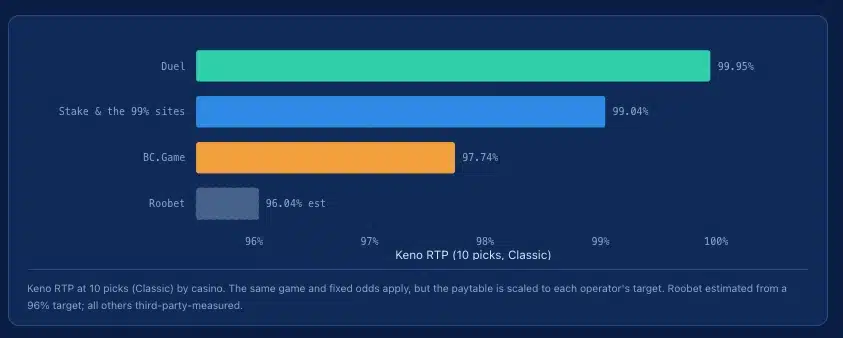
Across active market configurations, operator paytables fall into four distinct tiers:
| Operator Tier | Baseline RTP | House Edge | Loss per $1M Wagered |
|---|---|---|---|
| Ultra Tier (e.g., Duel) | ~99.95% | ~0.05% | ~$500 |
| Standard Tier (e.g., Stake, Gamdom) | 99.04% | ~0.96% | ~$9,600 |
| Mid Tier (e.g., BC.Game) | 97.74% | ~2.26% | ~$22,600 |
| Low Tier (e.g., Roobet) | ~96.00% | ~4.00% | ~$40,000 |
On a standard 99.04% table, every $1,000,000 in wagered volume carries an expected house take of ~$9,600. On a 96.00% table, that same volume carries an expected loss of $40,000.
Where Operators Hide the House Edge (The Mid-Tier Trim)
When an operator lowers a Keno game’s RTP from 99% to 96%, how do they do it?
They almost never touch the top headline jackpot. A 1,000x top multiplier looks identical on a 99% site and a 96% site because top-tier hits are so mathematically rare that altering them barely changes overall game return.
Instead, operators shave fractions off routine, high-frequency hits.
For example, on a 10-pick card:
- 99.04% Paytable: Pays 4.5x on a 4-hit match.
- 96.00% Paytable: Pays 3.5x or 3.0x on a 4-hit match.
Because 4-hit matches occur roughly once every 12 rounds (~8.0% probability), stripping 1.0x from that single payout quietly removes hundreds of basis points from the overall payout engine without changing the look of the game interface.
Where Players Bet: 3.8 Million Keno Rounds Analyzed
Our 7-day telemetry dataset tracked 3.8 million live wagers across 25 crypto casinos to evaluate how market volume distributes across these paytable tiers.
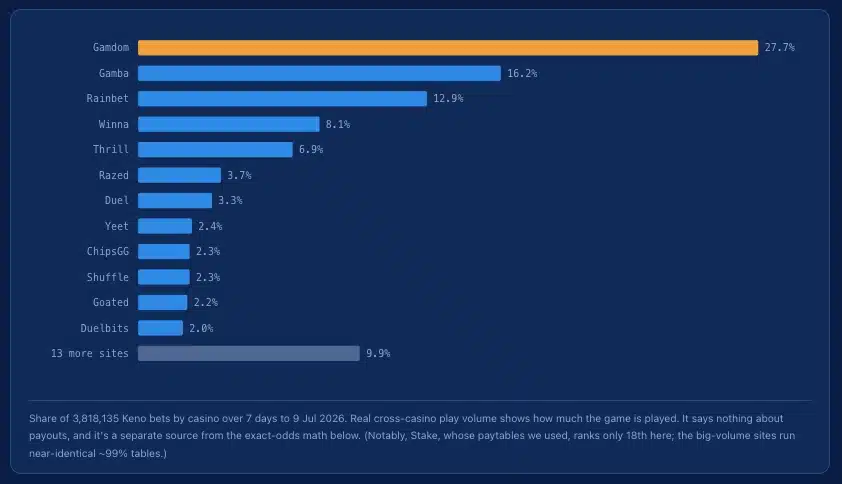
The telemetry shows that play volume doesn’t strictly follow raw math:
- Gamdom led the market with 27.7% of total volume, combining a Standard Tier 99.04% paytable with aggressive rakeback and platform rewards.
- Gamba (16.2%) and Rainbet (12.9%) captured significant market share by focusing on platform features and user experience.
- Lower-RTP sites (~96–97%) still processed millions in weekly wagers, primarily because headline multipliers look identical to high-RTP alternatives.
3 Steps to Check Any Keno Paytable in 5 Seconds
Because headline jackpots are identical across most sites, use this quick checklist to inspect any Keno board before playing:
- Check the 4-Hit Match on a 10-Pick Card: If 4 hits pays 4.5x or higher, you are on a high-RTP table (~99%). If it pays 3.5x or lower, the table has been trimmed toward 96–97%.
- Check the 3-Hit Match: High-RTP Classic tables usually pay 1.4x to 1.6x on 3 hits. Lower-RTP tables drop this to 1.1x or 1.0x (money back).
- Factor in Platform Rewards: High volume players should calculate whether VIP rakeback, deposit bonuses, and VIP perks offset an operator’s baseline paytable tier.
Want to compare exact operator paytables side-by-side and model long-term returns? Explore our full interactive data study: Keno: The Hidden Risk Dial.






Login
Register